
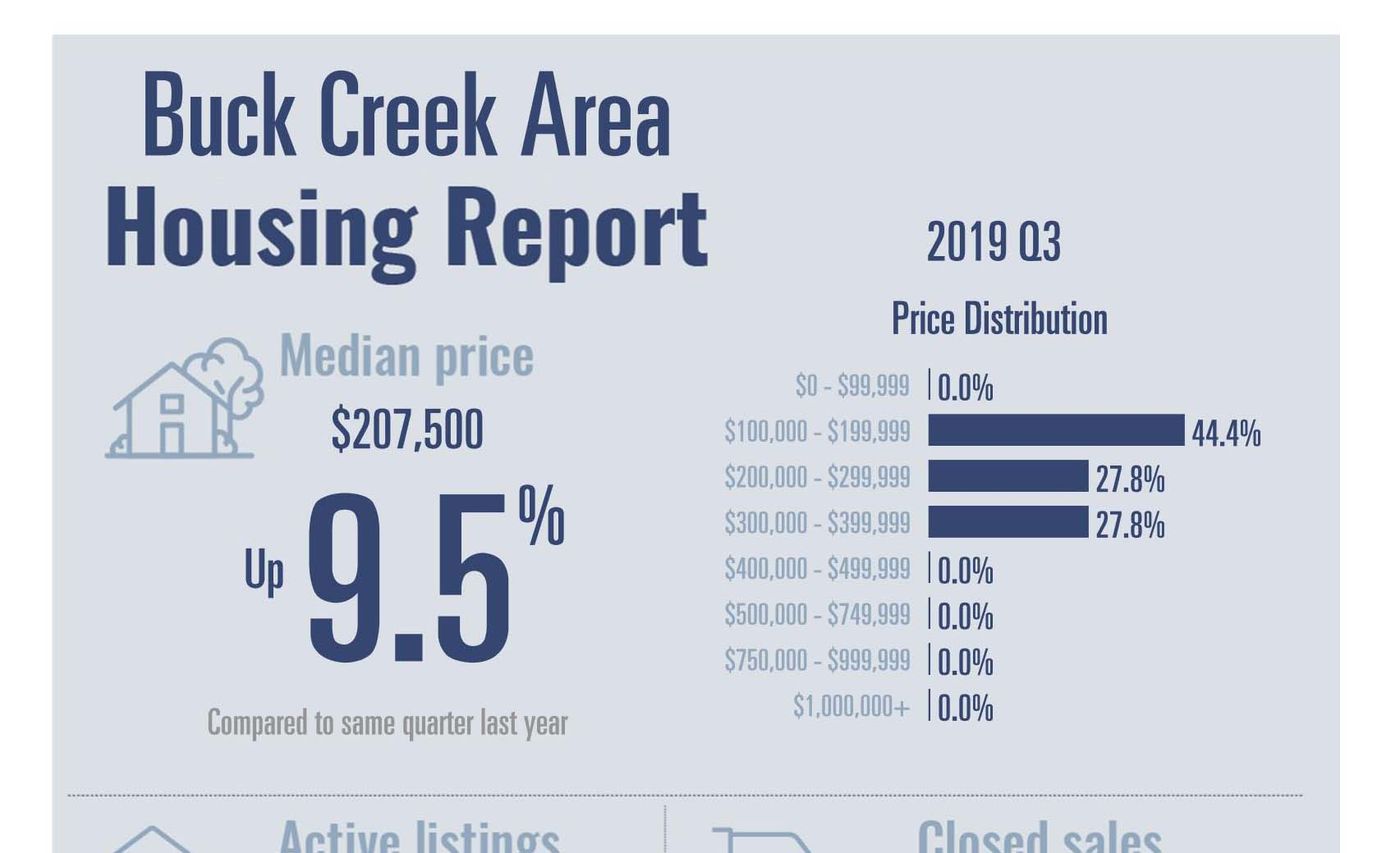
People love to know what’s going on in their local housing market, and who better to share quick-hitting infographics with them than you?
Thanks to MarketViewer—an exclusive benefit for members of Texas REALTORS®—you can easily generate the latest market stats for your city, ZIP code, or even many neighborhoods.
- From the MarketViewer dashboard, click the Report Menu red button in the upper-left corner
- Select Infographic Generator
- Choose your local board of REALTORS®, your market type, market area, frequency, reporting period, and the type of file you’d like to download
- Click the download button.
Your infographic will be ready to share on social media, via email, and in your marketing materials.
Comments
There are no comments yet.